Ending the Project Priority Tug-of-War
May 23, 2018
Ending the Project Priority Tug-of-War
by Rishab Rao
“The key is not to prioritize what’s on your schedule, but to schedule your priorities.” – Stephen Covey
Everything’s a Priority!
Endless project lists, perpetually looming deadlines, lengthy project durations, not enough time and resources, everything must get done now! Sound familiar? Something’s got to give, and it should not be your sanity or your team’s morale. The solution is a robust methodology for systematic project prioritization and project load management.
Imagine taking a distance measurement without a scale of reference such as a tape measure. Unless you’ve got a very practiced eye, your measurements will be off most of the time. Similarly, without a solid framework for prioritizing projects, the project environment will always seem like a landscape of shifting priorities. Like a tape measure employs a system of agreed upon units—inches, centimeters, or feet—your prioritization scale must follow an agreed upon system of measurement. This fundamentally changes the way projects can be prioritized.
My clients often tell me in frustration that they, in fact, do spend a lot of time prioritizing projects. Yet they continuously grapple with poor completion rates, project scope creep, seemingly shifting priorities, overburdened project resources, and crushing deadlines. This landscape of endlessly shifting priorities is not only maddening, it also burns up precious project activity time. Shifting project priorities are a clear indication that the prioritization criteria are not firmly anchored to the steadfast strategic objectives of the organization.
There are five steps to methodically break down strategic objectives into project-level criteria that have meaning and impact at every level of the organization. The goal is a robust and consistent project prioritization framework that improves project productivity and reduces stress on project managers and their teams. This approach also puts into place a systematic and compelling way of saying “No” to additional project burdens.
Step One – Clarify Strategic Objectives
If you want to fix the moving target of priorities, the first step requires engaging the leadership team in conversation to understand and clarify the strategic objectives of the business. Explore what each of the objectives mean and why they are important at this time. Also explore how the strategic objectives relate to the vision and mission of the business for comprehensive clarity.
Understanding the strategic objectives from the perspective of the leadership team offers valuable insight into each objective so that the latent operations objectives reveal themselves more readily. Each strategic objective is laden with multiple project priorities. They must be individually examined and distilled into more granular objectives before practical project prioritization criteria can be developed.
This may sound arduous. You are darn right this is arduous! However, this approach is far less tedious than the alternative. Every function, department, initiative, decision, and task within the organization must be measured against an appropriate, unmoving set of criteria. These criteria must evolve from the overarching business strategy. If any prioritization criteria in the organization cannot be traced back to the strategic objectives, they need reevaluation for congruence.
Example:
Strategic Objective = Increase Profitability by 20%
Step Two – Extract Operations Objectives
Conduct a simple experiment: ask several people in your organization what the strategic objectives of the business are. Some may not know the answer, and some may know varying versions of the answer. Of the respondents who have an answer, ask them a follow up question: how do those strategic objectives help you prioritize your daily tasks and projects? More than likely you will get abstract answers or a confused look. In fact, this is the norm across the board in every industry. The leaders of an organization are often prodigious at creating strategic business objectives. Where many leaders fail is in the translation and dissemination of these objectives throughout the organization.
High level strategic objectives hold little relevance for the daily tasks of the frontline employee. Strategic objectives are simply too contextually nebulous to be useful at the project level. Thus, they cannot be directly employed as prioritization criteria and must be translated into operational goals and targets.
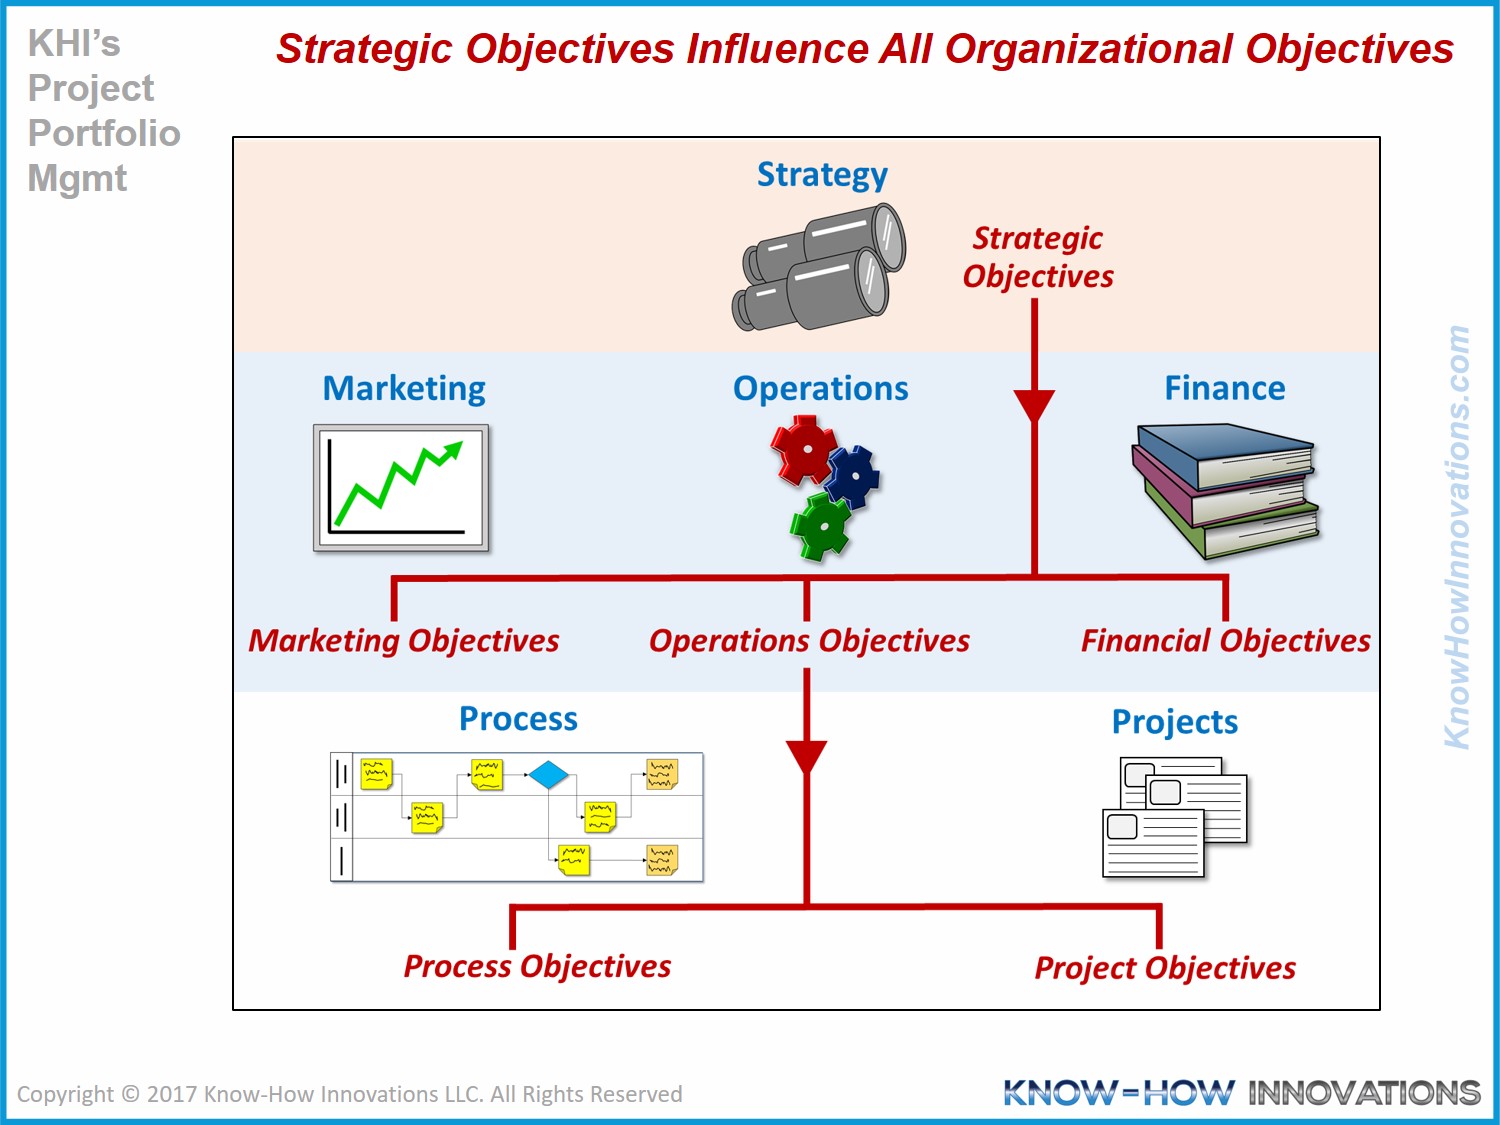
Source: KHI’s Project Portfolio Management
The first step is to break the objective down into its components, quantitatively when possible. Brainstorm to wring out as many operations objectives that would support and achieve each strategic objective as you and your team are able to garner.
Once the brainstorming is done, condense the list by eliminating duplicates, combining related objectives, looking for cause and effect relationships between objectives, and removing the effects from the list.
Tip: Do not limit brainstorming operations objectives to existing objectives. Create new ones that are practical and can potentially move the needle on the strategic objective. Brainstorm divergently in stage 1 (more is better) and condense convergently in stage 2 (fewer is better).
Example:
Increase profitability = Increase Revenue and Reduce Expenses
Extracted list: Revenue, Expenses
Step Three – Refine Prioritization Criteria
The next task is to further break down the operations objectives from the previous step into criteria directly relatable to projects and daily tasks. The goal is to strip away any context around the objectives to reveal raw metrics1 that can be monitored. The question to ask is, “What performance indicator(s) do we measure or need to create in order to move the needle on a particular operations objective?” Flush out as many indicators and metrics for all objectives as conceivable.
There is a plethora of ways to identify and establish the appropriate criteria for each objective. The simplest method is to list all metrics within the span of control of a department and match the ones that have an impact on each strategic objective, and their desired direction (increase or decrease).
Tip: To create a list of indicators, think in terms of personal safety, information security, product or output quality, process efficiency, activity and input costs. At the end of the session deliberately add one more criterion: ease of execution. This balances out aggressively chasing every criterion. Keep this list to five or fewer criteria.
After establishing the relevant criteria for each objective, you will meet with the leadership team to convert these criteria into numerical values. First, briefly explain how you arrived at the prioritization criteria. Next, comparing only two criteria at a time, designate which is “more important” and which is “less important.” Have criteria definitions ready for clarification. When all criteria have been compared, sort the list in order of decreasing importance. Finally, as a group distribute 100 points across the list. No two criteria may have the same number of points, and the resulting point total must be equal to 100.
Tip: Do not reveal the project list until the prioritization criteria have been established. The point is to establish relative importance, not to debate the merits of individual projects.
Example:
Increase Revenue = Increase operational capacity, reduce product / service delivery time. Reduce Expenses = Increase efficiency and quality rates, increase process completion rates.
Condensed List: Increase Capacity (Throughput2), Reduce Process Lead Time3, Increase Efficiency (Throughput), Reduce Quality Error Rate4, Increase Process Completion Rate (Process Lead Time).
Refined Criteria List: Increase Throughput, Reduce Process Lead Time, Increase Error Rate, Ease of Execution
Refined Criteria with Relative Weights:
Increase Throughput – 35 points
Reduce Process Lead Time – 30 points
Reduce Error Rate – 20 points
Ease of Execution – 15 points
Step Four – Prioritize Using an Impact Scale
The condensed criteria from step three serve as the basis for a highly project-relevant scale of measure for prioritization. However, it is difficult to have a qualitative conversation regarding the impact of a certain project on a specific criterion. It is significantly easier to have this conversation quantitatively so a relative impact scale is needed.
For each criterion, establish a High-Medium-Low-No Impact scale with a numerical points system; 9-3-1-0, respectively, is recommended. With this prioritization system in hand, begin evaluating the impact of each project on each prioritization criteria. Ask the question, “If this project is completed, what would the resulting impact on each of the criterion be?” The answer will be high, medium, low, or no impact – captured numerically 9, 3, 1, or 0.
Once every project has been evaluated for impact on each criterion and this information is captured in a Prioritization Matrix, calculate the project priority number. The project priority number is the sum product of the criteria weights and the impact numbers. The greater the priority number, the higher the priority of the project.
Example:
Imagine that the team agrees that the project Reduction in New Employee Onboarding Time has the following impact on each criterion:
Increase Throughput: Weight = 35, Impact = 1 (low)
Reduce Lead Time: Weight = 30, Impact = 9 (high)
Reduce Error Rate: Weight = 20, Impact = 3 (medium)
Ease of Execution: Weight = 15, Impact = 9 (high)
The sum product of the impact scale and the criteria importance score is 35×1 + 30×9 + 20×3 + 15×9 = 540. The project Reduction in New Employee Onboarding Time has a priority score of 540 out of a possible 900.
As a general rule, projects with priority numbers greater than 540 are of higher priority while the ones with lower priority numbers are of lower priority.
Use this Prioritization Matrix Template (includes an example) to structure and conduct the project prioritization exercise.
Step Five – Manage Resource Loading
Although it may be tempting to do so, refrain from fully loading every project resource. Resources should be loaded no more than 95% of their total available time. This allows for a 5% margin for uncertainty. If you overburden project resources with more work than their capacity you risk negating the benefits of this prioritization exercise. Fill the project execution schedule for 6-12 months and no more.
Once the project pipeline is established based on this prioritization process, make sure all stakeholders know that any requests for additional projects will be routed through the project prioritization process before being added to the pipeline. If the priority number of the new project fails to out-prioritize other projects already in the execution pipeline, then it must simply wait its turn. If the person requesting the project insists, shift the conversation away from comparing the individual projects to the priority system. Have the discussion within the context of the criteria, scale of impact, and priority numbers rather than a subjective conversation based on assumptions and myopic foresight.
Do what is necessary to field incoming projects, the originators of which often try to circumvent the prioritization process. Let that be met with a very methodical “No.”
Reap the Rewards
Project selection and prioritization is the critical front-end component of Project Management. The prioritization system must be built upon a foundation of unwavering strategically aligned criteria. This results in a consistent methodology for creating an efficient, impactful project execution schedule that delivers quality results on time. This systematic approach also sets clear expectations on work load limits and project completion times for all stakeholders.
References:
- Metrics are indicators or factors that measure a trend. For example: speed (metric) is used to measure pace (trend).
- Throughput is a measure of how fast a process step can convert inputs into outputs measured in units/time. For example: the number of insurance claims that can be evaluated and processed per day.
- Process Lead Time is the time it takes from beginning to end of an entire process. For example: The time between placing an order online until the item is delivered at the customer’s door.
- Quality Error Rate (%) is the number of defect units of output divided by the total number of units produced per day inclusive.